Jamovi
Statistical Software for education has typically been divided between expensive, good looking software and free code solutions. A free solution like R might be good for computer science students, but too complex for entry-level Health Sciences class. A point-and-click statistical system like JMP or Minitab would be good there, but the cost during and after they leave education can make it less accessible. Enter the third option: open-source point-and-click statistical software like Jamovi.

Jamovi is not the first software to this open-source market, or even the last, but its features and design seem best suited for education and beyond. This means students have access to free software with an easy to learn point-and-click system, all built on the foundations of, and access to, the R platform.
Device compatibility is a strong point for Jamovi. There are native Windows and Mac version, Linux and Chromebook versions, and even a web version. The web version is still in beta and lacks some functionality, but more is continually being added. So regardless of their students device will have access to the software.
The Interface
Jamovi follows the standard point-and-click interface seen elsewhere statistical software. A data pane on the left, and an output window on the right. There is also a dedicated variable view interface which makes it easy to setup variable details.

As well as a user friendly interface the Jamovi system has nice customizability with colours and various levels of decimals. It grants the students a number of important transferable skills to other statistical software with similar layouts.
Syntax mode and Rj
As Jamovi is built on the R platform, there is a toggle to let you peer into the code. The Syntax mode will show you a little of what’s going on behind the scenes. But if you want more the Rj Module allows you to run and compile R code within Jamovi. This is the module to go to if there is something you want to tweak in how the analysis is run, or you just want to practice and try out coding in a place that is familiar. But the Rj Module isn’t the only module available in Jamovi.
Modules
A limitation of any point-and-click system is that each option has to be available in a menu. The base system of Jamovi is enough for most students, and the Rj module gives you access to code, but sometimes you’ll need a new module. Essentially modules are a way to add functionality above and beyond what the developer deems core to the product.
Modules include everything from sample data, simulations, quantiles of distributions and even arcade games of Hangman and Blackjack (Great ways to get students familiar with the system).
Can’t find what you need? There is extensive support for creating your own modules. Core functionality is written in the R coding language with a simple and intuitive coding layout, written in Jamovi, for the user interface pieces.
Demonstrations
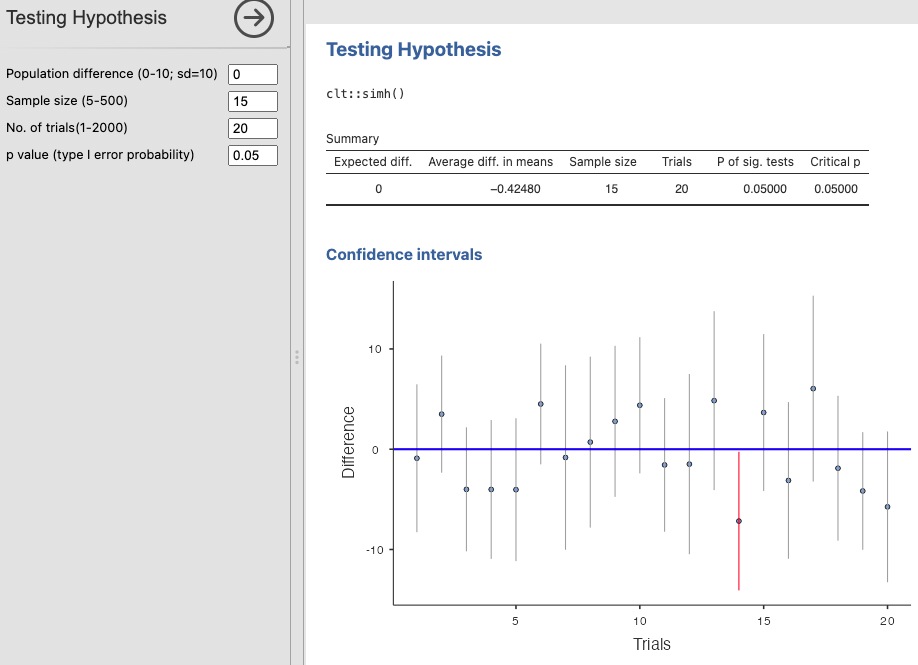
If you’re looking for simulations of some good first year concepts, look no further than the demonstrations modules. This module has quick simulations for coin tossing, dice, the Central Limit theorem, correlation and even hypothesis testing. These tools allows students to play with sample sizes, and other variables to see how statistics work in large sampling scenarios.
distrACTION
Of course my favourite modules is distrACTION, which adds support for probabilities and quantiles from various distributions. This is not something that you would probably need in general statistics research, but is extremely common in education. It is my favourite module because when I investigated using Jamovi for my classes, I noticed there was no way to easily calculate Poisson probabilities. It wouldn’t be terrible for them to only calculate them by hand, but I thought we could do better. The documentation support for Jamovi modules is so good that it only took a few days to figure out the code for the binomial distribution in the distrACTION module, make a copy and update the module to add support for the Poisson distribution. The development community was also incredibly helpful. And now, the distrACTION module supports the Poisson module.

Summary
Jamovi is a great out of the box solution for most statistical software needs, but is open-source and extensible to what ever your scenario needs. Being free allows it to be quickly, and easily tested, even the web interface is a great place to see if it will work for you. There is great article by Edelsbrunner, Peter (2017-03-23) talks about the origins of Jamovi and where it came from. Try it out for yourself.

