Statistics Software for Education
Calculating statistics for any but the smallest datasets requires software. This means that a professor must choose a software package to pair with a statistics course. Subsequent professors, and other courses, will most likely use the same package so it’s not a decision to take lightly.
Statistical software in education falls into one of three main types: spreadsheets, menu driven systems, or command line systems. Each of these has their own special uses, but what best suits your class is up to you.
Spreadsheets
Spreadsheets such as Microsoft Excel, Apple’s Numbers, and Google Sheets are the most common software for people new to statistics. They have a grid of cells and rely on equations that reference other cells to perform statistical calculations. The data itself has no special entry or placement and any complex computation and output must be designed and placed by the user.
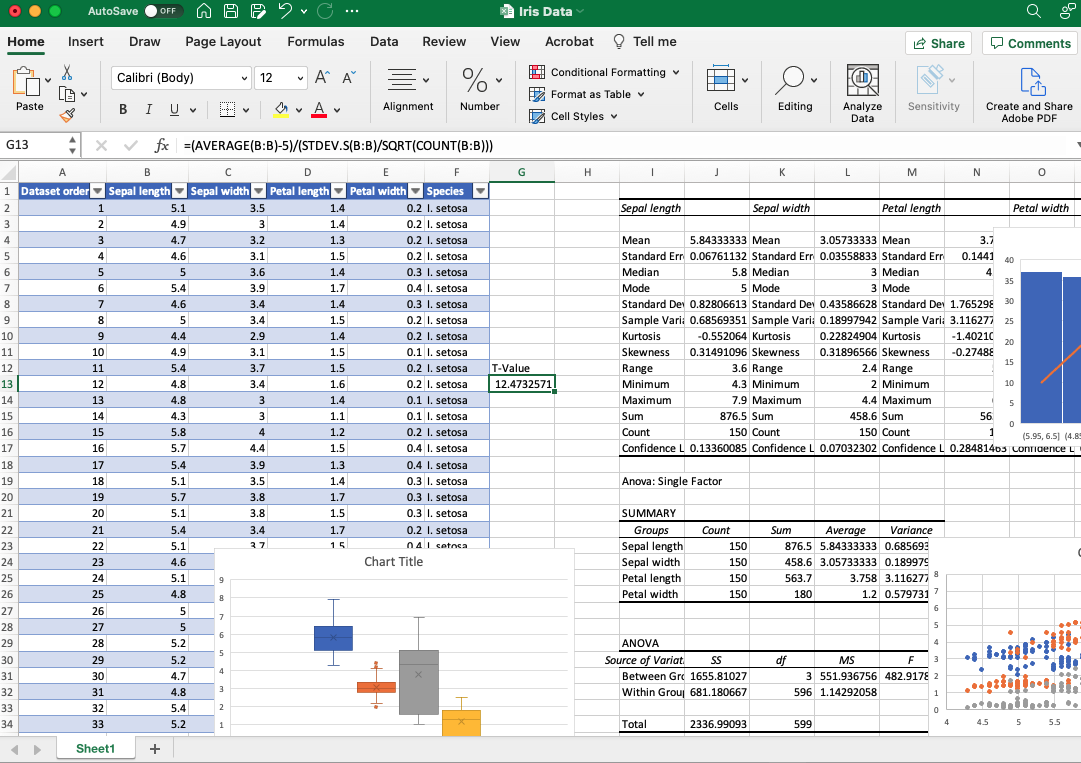
Since data is often collected and organized in spreadsheets it is logical to continue analysis there. Although some preliminary analysis might be possible, easy, and convenient, but be wary of taking it too far. (See the UK COVID-19 reporting error due to data processing errors in Excel)
One major advantage of this type of software is that they are often part of a suite of tools the user has received as part of their education or has already purchased. As such they do provide a basic level of statistical analysis in addition to the other functionality already provided.
Despite having a rich visual, menu-driven interface most of the statistical functionality comes from coding text directly in cells. Commands are available in the software, and built-in systems auto-complete as you type, but without special add-ons though, complex statistics require programming the commands yourself. The Data Analysis Toolpak add-on does have some complex functions pre-packaged but are limited to basic entry level functions. This provides no pathway to future learning and advancement for the student should they ever want to continue learning statistics.
There’s also good merit to learning new software paradigms. Students are faced with a barrage of new software when they get their first job so some flexibility here can go a long way. Chances are they’re already familiar with Excel so maybe this is the opportunity to introduce them to some statistics software.
Menu Driven
Menu driven, or GUI (Graphical User Interface) statistical software is a category of applications where analysis operations are controlled through point-and-click menus. These include applications such as MiniTab, DataGraph, JMP, SPSS, and S-Plus. As a dedicated statistical system these also share a distinctive layout. The hallmark design here is a dedicated data window and separate output window.
For educators this menu-driven interface provides a number of advantages. A student can explore the software themselves by navigating clickable options and trying them out. As well, the systems often include guides or tutorial learning platforms like Quality Trainer for Minitab. Most importantly, as a dedicated statistical software package they include basic but also advanced level statistical analysis. Students won’t run out of learning without some graduate level classes. Lastly, many industries rely on this class of menu-driven software so students can be trained quickly trained on the job.
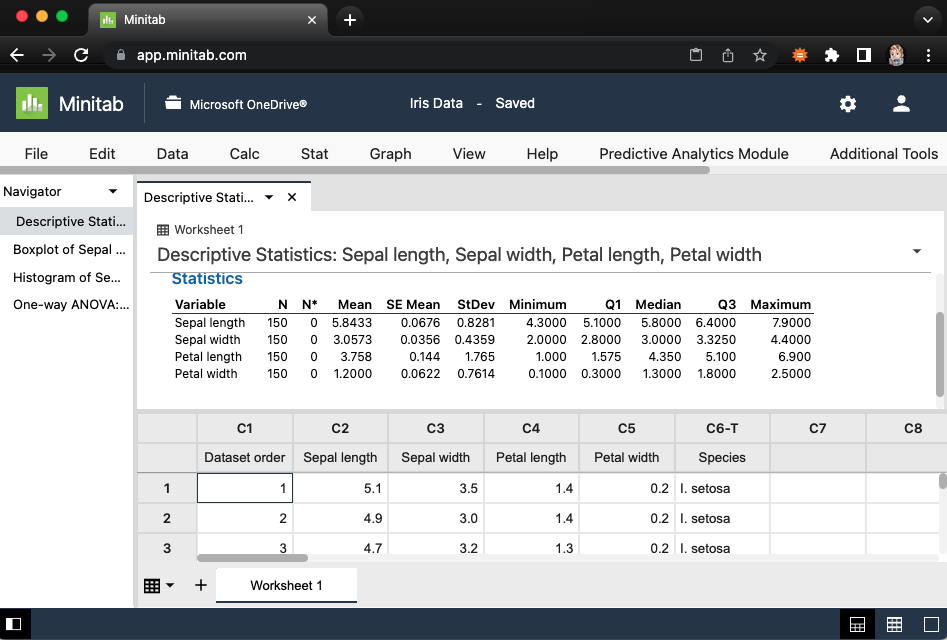
As a dedicated statistical application the data window is more than a spreadsheet. Here users can perform advanced data handling such as defining the data type (nominal, ordinal, continuous) for each variable and adding longer descriptions for each variable. There are even special systems for handling missing data codes, so text like “N/A” can be included properly in a numerical column.
In addition to the data window they have a dedicated way to output analysis. Having a simple window where each new output is added to the bottom keeps it separate from the spreadsheet view. An advantage of the menu-driven system over a simple spreadhseet is that past analyses are organized and can referred back to.

Cost is probably the biggest issue though. School-wide licences are common for class and academic research, and businesses often also foot the bill for employees. However, if an individual wants to buy a personal copy they often run in the thousands of dollars per year. This cost is justifiable with the complexity of the GUI interface and ease of use, and the systems often contain proprietary functionality that some industries rely on. But for a student exploring statistics after the class for a capstone project or to impress their boss are crippled.
As extensive and easy to use as the menu-driven interface is, that easy use means that every option has to be part of a menu or toggle somewhere in the system. Statistics is an ever changing and improving field, so new cutting edge methodologies are often not available. When it comes to implementing new approaches what you really need is a way to write your own analyses.
Command line
The last class of software is those that utilize a command line system to interact with the program. The two main command line statistical packages are SAS and R. Systems like Python or Julia are often used, and really any coding language could be used for statistics. This flexibility is a main advantage of the command line option.

The R system is an open-source project meaning that many people have written packages and guides for the system. This also includes dedicated teaching packages, like Swirl, where students can learn to use the system, in the system. As a free-to-use system students and faculty have no barrier to entry and can continue to use their new statistical skills well after the course ends. And since they are open source you, the teacher, can make and customize packages to match exactly your curriculum. For these reasons many industries and much of published research now completely relies on the R software. This makes it an excellent choice for education, creating job opportunities and future learning for students.
A significant advantage is that nearly any operation can be designed and coded into the system. However this means that the user must know each command and operation ahead of time, and this statistics course has now also become a first-year computer science class. Students learning with these systems often do little more than copy and paste the professor’s example code to get output. Being a command-line only system the student has no way to explore without reading lessons and examples from others. This is an advantage when you consider the value for students learning multiple new and different systems in education, but few courses have the time to execute two subjects at once.
Choosing the right system
Spreadsheets offer us simple to use systems that can be applied to day-to-day activities, but lack advanced statistical options, data handling and output systems. Menu-driven systems have advanced statistical options, easy to use data handling and output, and create excellent transferable skills within this class of software. However they can lack some really advanced functionality and come at a substantial cost. Command line software has nearly limitless possibilities for functionality. They often come at no cost and have extensive open-source communities and exceptional transferable skills. But for these same reasons they pose a very large barrier to entry for a basic statistics class.
Given a budget and support of the school, choosing one of the menu driven options is probably the best decision for a good all-round solution. Students get to learn a new interface design that supports their learning and makes finding and using functions easy. Chances are your school already has a licence for one, or more, of these programs. And with a little encouragement other faculty can reap the benefits of students being trained on statistical software. The downside being that students may be unable to access this software in future careers. Fortunately those skills are easily transferable to any of the menu driven systems.
If students are coming into the course with a foundation in coding you may want to try a statistical platform like R. For students doing a single statistics module as part of a course, using the Excel functionality may be an option to explore.
New, game-changing options are starting to come to market that may put all of this on its head. For years there has been an idea of a free, open-source, academic focused statistical package that uses a menu driven interface. But that’s a story for another day.

